




2. BPS and FD Processing Overview#
2.1 BPS Overview#
The BIOMASS Processing Suite (BPS) is in charge of processing BIOMASS Level-0 data up to Level-3, generating a wide set of products. Product generation scheme is depicted in the following two figures respectively for the TOM phase and INT phase. The processing foresees the following steps:
L1 processing: the BIOMASS image formation step, taking as input 1 L0 slice and generating as output N>=1 L1 frames;
Stack Processing: the coregistration and stacking processing step that will define the required 7-images Tomographic stacks or the 3-images Interferometric stacks. It includes stack phase calibration;
L2a Processing: processing step for each stack that provides the inputs to the further products Tile Generation performed by the L2b processors. For one global cycle the number of stacks varies mainly with latitude, approximately from a minimum of two at the Equator (ascending/descending) to about six at higher latitudes (three ascending/descending pairs);
L2b Processing: processing that aggregates all the stack-based L2a products insisting on the same location on ground (Tile) in the same time interval and generates a single BIOMASS L2b product. A different number of stacks may be available for each DGG tile [RD8], based on tile dimensions and swath coverage (which is not related to DGG tiling pattern);
L3 Processing: consolidation processing removing discontinuities in L2b products.
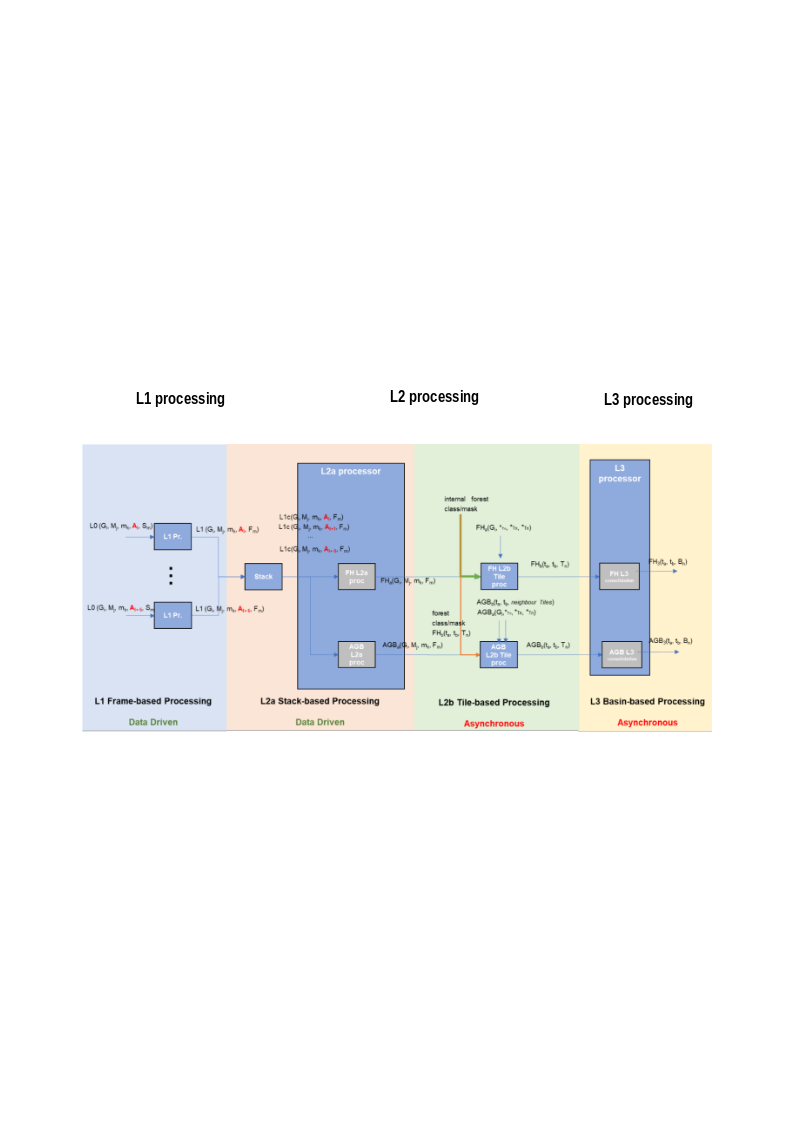
Fig. 1 — Biomass high-level processing scheme from L0 data to L3 products, TOM phase.
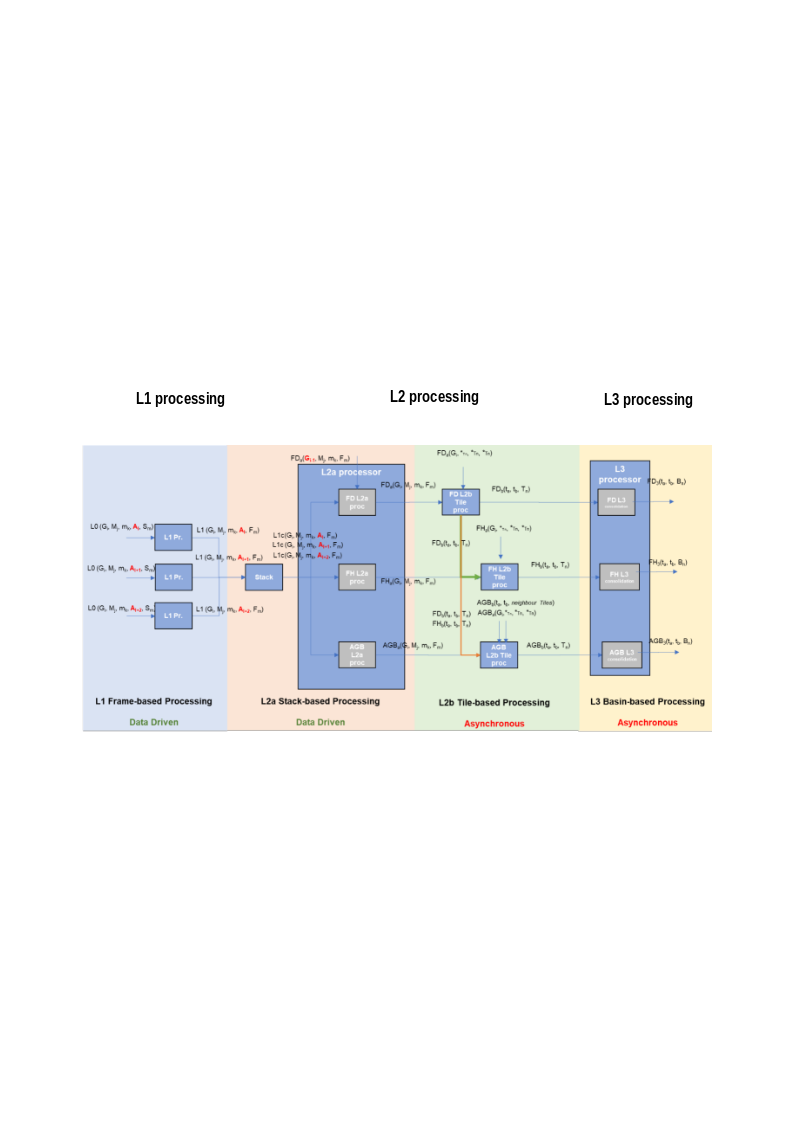
Fig. 2 — Biomass high-level processing scheme from L0 data to L3 products, INT phase.
2.2 FD Processing Overview#
The FD processing runs during INT phase only and has as main goal the generation of maps of high-intensity change between successive temporal cycles due to deforestation (logging, fire etc.) at a spatial resolution roughly equivalent to ~50 m x 50 m (i.e. 0.25 ha) at the Equator [RD9]. It receives as input a stack of BIOMASS Level-1c images (SCS co-registered and calibrated stack), including its relevant annotated data [AD3]. The FD processing is divided into three levels:
L2a, generates a map of the probability of change from each L1c stack based on statistical hypothesis testing algorithm, as well as a forest disturbance map and a Computed Forest Mask (CFM), accounting for the cumulative disturbance updates;
L2b, generates a forest disturbance map merging all the L2a products on a geographic grid tile, as well as an aggregated probability of change map and CFM;
L3, consolidates the result removing discontinuities in L2b products.
The production model foresees the additional optional possibility of having an FD product also from TOM phase [AD1]. In this case the product would contain only average covariance information (ACM) to be used during the first INT cycle for the computation of disturbance (Section 3.7.4.3).
Note
L3 processing currently does not entail any additional step with respect to L2b. This will be confirmed/reassessed at future milestones. For the moment L3 is kept as a placeholder for eventual future evolutions. Eventually, L2b can be an empty container and the product will be copied to L3.
Note
Provided that FD algorithm proper validation will only be possible with BIOMASS in orbit, the strategy proposed to deal with FH/AGB dependency on FD is to initially input to FH/AGB a forest/non-forest mask generated outside of BPS [AD1] [AD2]. After testing FD performance with BIOMASS in orbit, FD dependency can be switched on again, provided it has a satisfactory performance. The diagram of Fig. 2 reports nonetheless FD input for completeness.
Note
L2 processor receives from Stack processor L1c products with two co-polarization (CP) channels and one cross-polarization (XP) channel. Details on the aggregation of XP channels into one XP are reported in [RD1].
Note
Regarding stack images cardinality, their number can vary (not always 3 or 7) due to contingency reasons and it can go up to 8 in TOM phase.
2.3 FD Processing Workflow and Algorithmic Overview#
The main steps of FD processing workflow are depicted in the following figure and described in detail in the following sub-sections. This algorithm is an enhancement of the one described in [RD9].
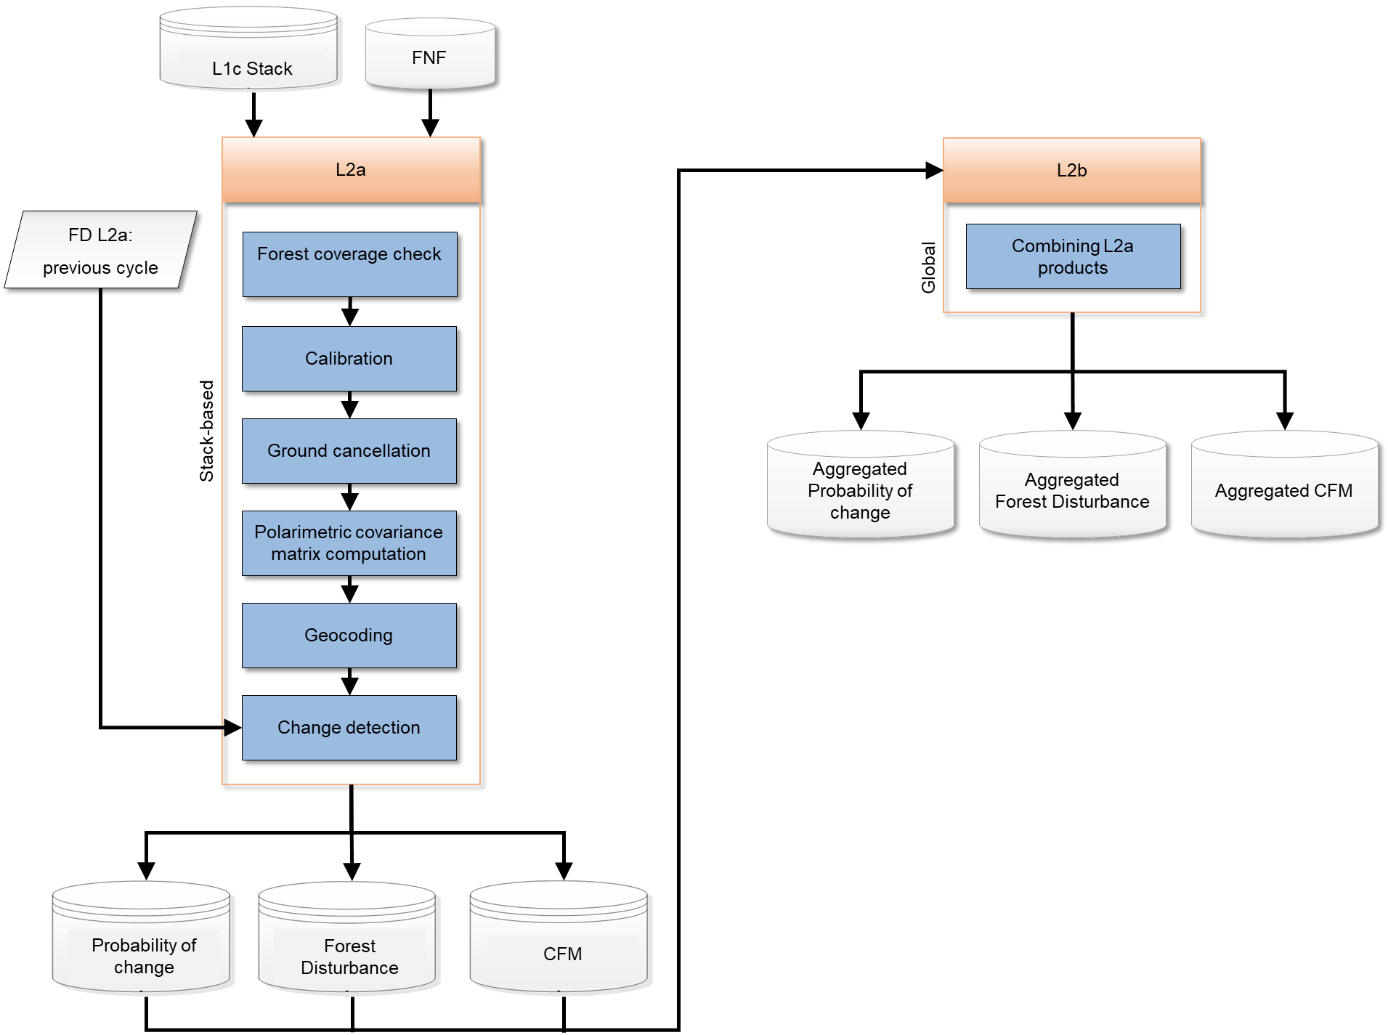
Fig. 3 — FD processing detailed workflow.
2.3.1 Change detection (L2A_P)#
The main steps of the stack-based L2a block are:
forest coverage check: predetermine which input data (as a whole image) should need to be processed;
calibration: application of phase calibration and ground steering (terrain at zero elevation) screens to the stack;
ground cancellation: removes the contribution of the ground scattering from the stack;
polarimetric covariance matrix computation: computes the polarimetric covariance matrix from ground cancelled data;
geocoding: projects the processed data on a geographic map, accounting for the different forest point locations with respect to the reference DEM;
change detection: computes the probability of change from hypothesis testing between the covariance of the current and previous cycles and computes disturbance maps from L2a probabilities of change for each stack.
2.3.2 Change detection aggregation (L2B_FD_P)#
The main steps of the L2b block are:
combining: fusion of L2a estimates at map level.
2.3.3 Note on interpretation of inputs and outputs tables#
Inputs and outputs for each processing sub-step are summarized in specific subsections (two subsections for each substep). A specific tabular format is defined to improve the access to the document. The meaning of each column is exemplified in the following table.
Symbol |
Name |
Origin/ Destination |
Size |
Variability |
Default |
Description |
|---|---|---|---|---|---|---|
Mathematical symbol of the quantity appearing in formulas. |
Name of the quantity as related to other BPS documentation (e.g., |
BPS document name describing the origin of the quantity or processing step of origin/destination or BPS product of destination. |
Dimensions of the quantity. |
Range of values or update rate of an internal resource. |
Default value for configuration parameters. |
Verbal description of the quantity and its characteristics (e.g. measure units, …) |